Names areborn.
Where do Switzerland’s favourite baby names come from? Yearly rankings show who leads, not how names travel. This project follows today’s 20 most popular girls’ and boys’ names back to 2000, across the country’s language borders.
View project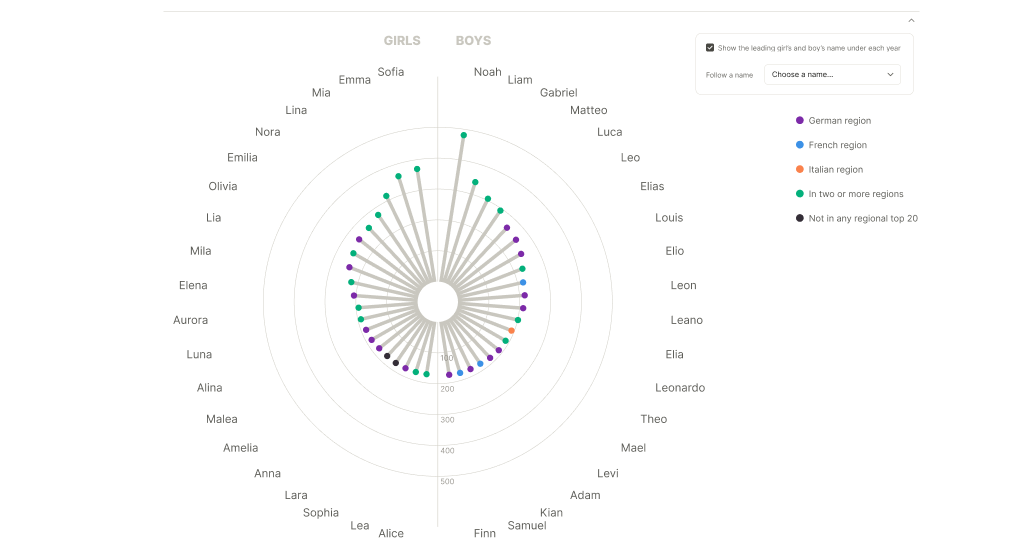
I worked with the Swiss Federal Statistical Office’s first-name data for 2000–2025: national counts and ranks, plus counts and ranks for the German-, French- and Italian-speaking regions.
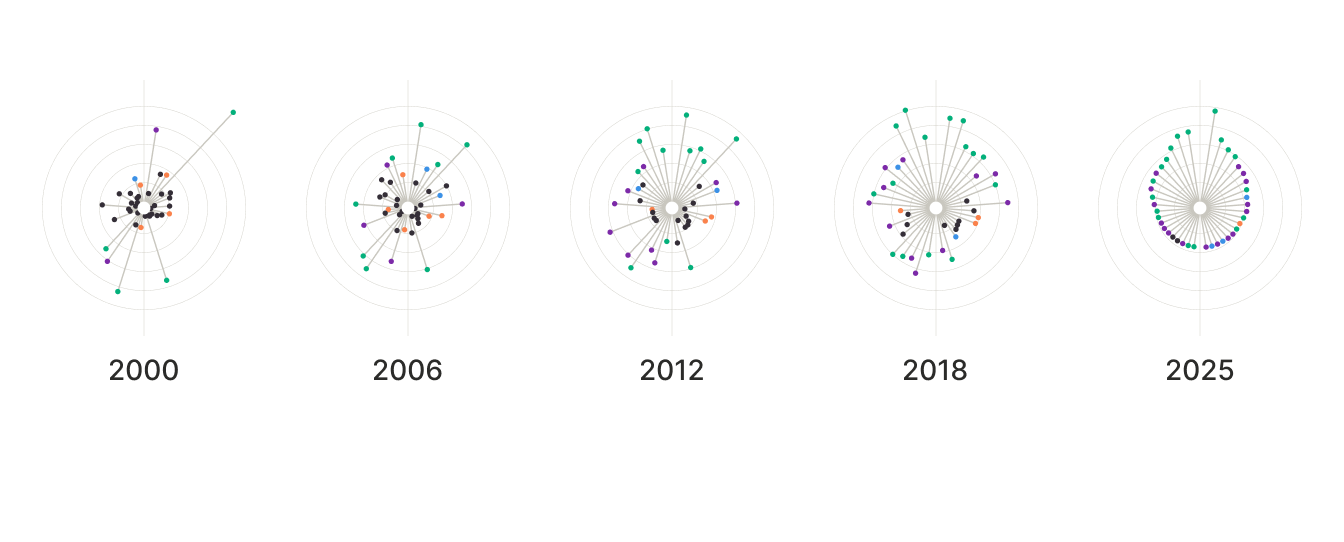
672 × 271 · export at 2×
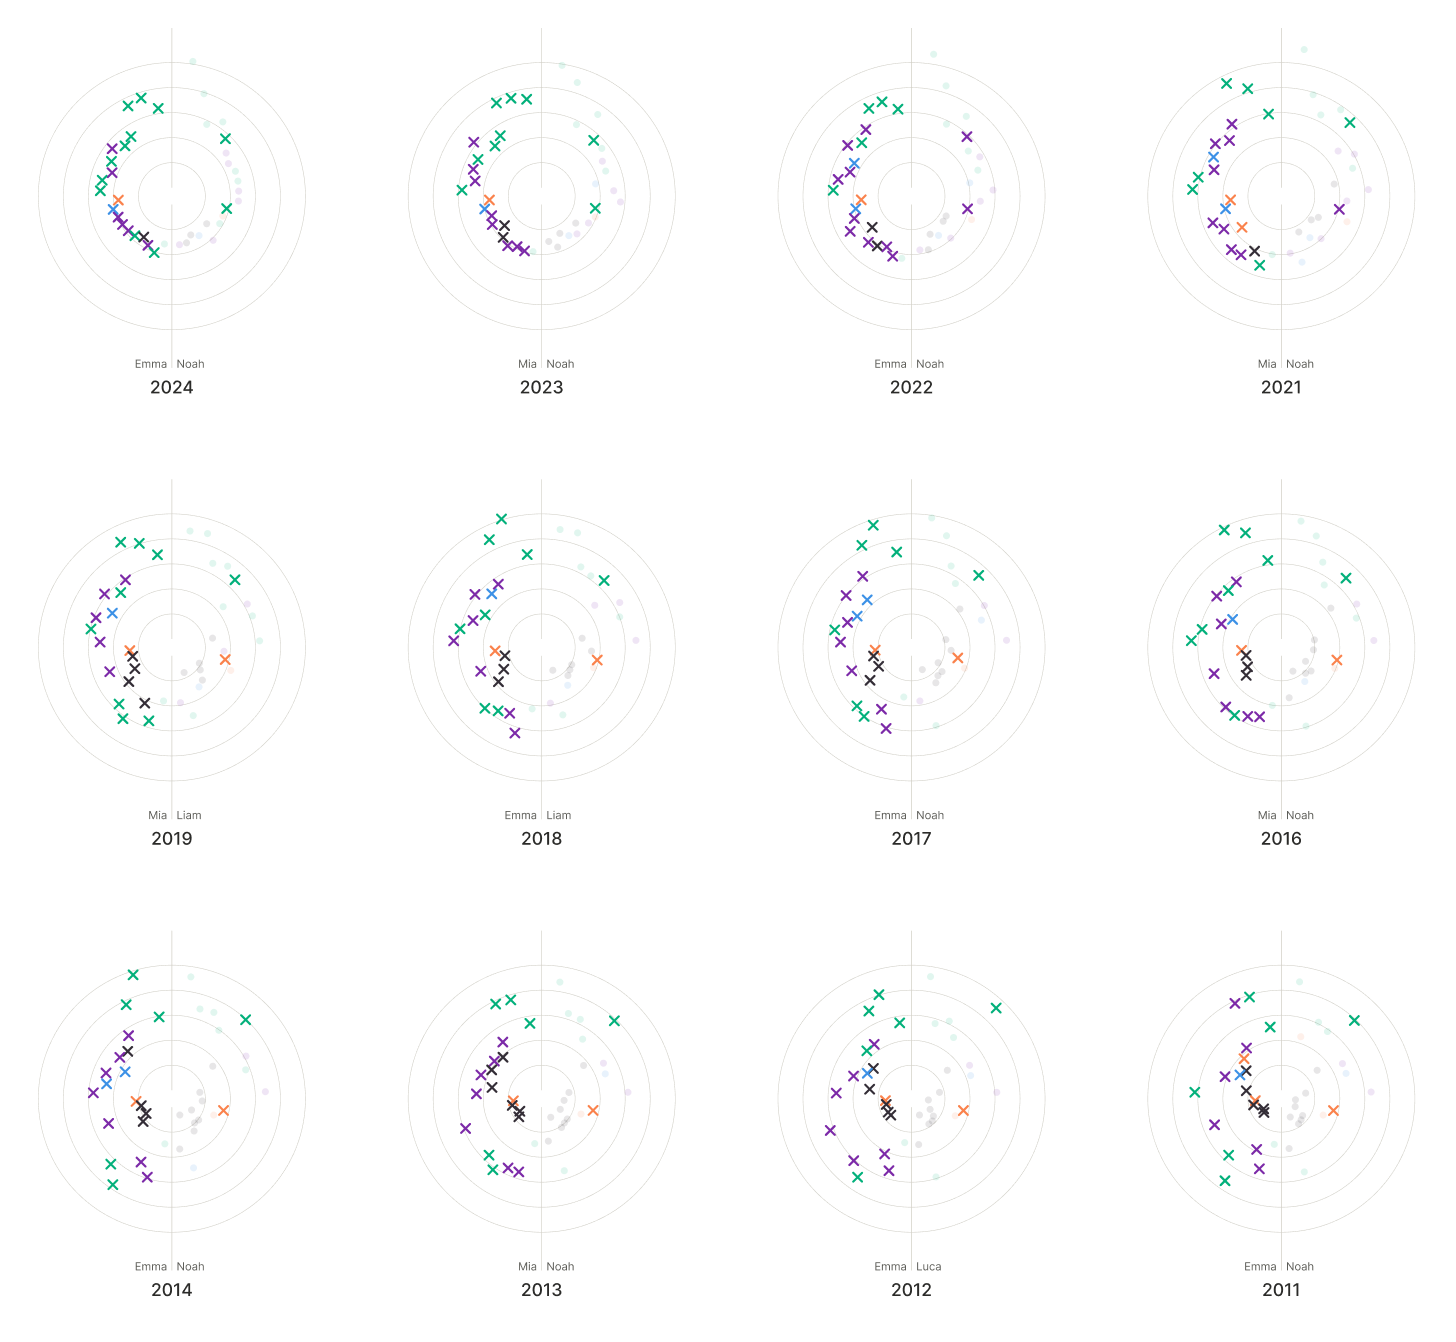
Girls on the left, boys on the right, every name always pointing in the same direction. The further a dot reaches, the more babies received the name; its colour shows where the name ranked in the top 20 that year. Top = highest rank.
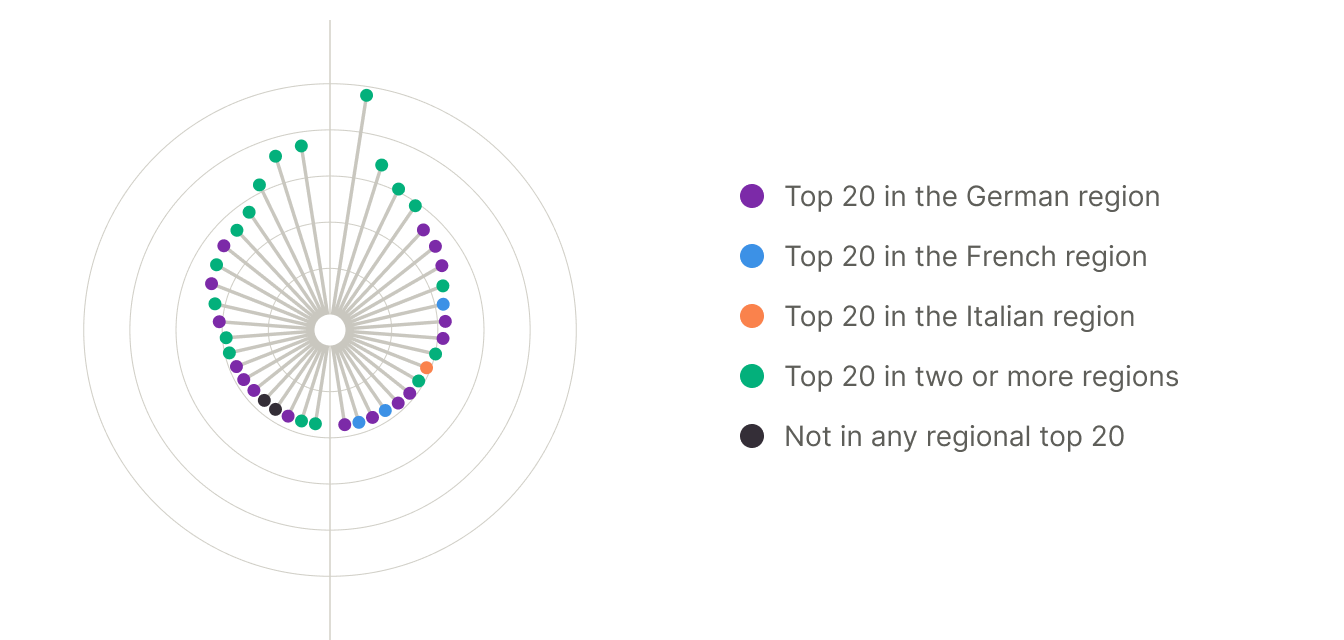
672 × 320 · export at 2×
The lollipop design creates radial bursts. Coloured end dots keep the centre light and make each value easy to read against rings at 100–500 babies.
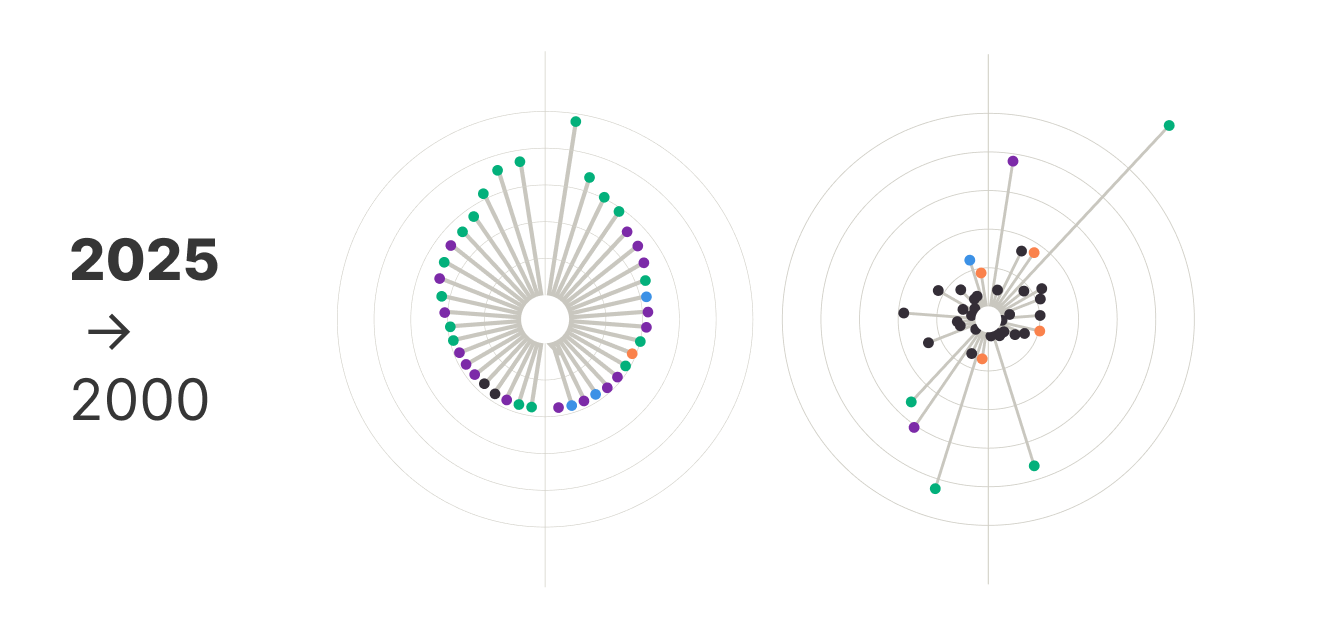
672 × 320 · export at 2×
A grid of 25 circles that, from a distance, resembles fireworks celebrating a good time. Each one captures a year, with the large 2025 circle as the centre point of the data.
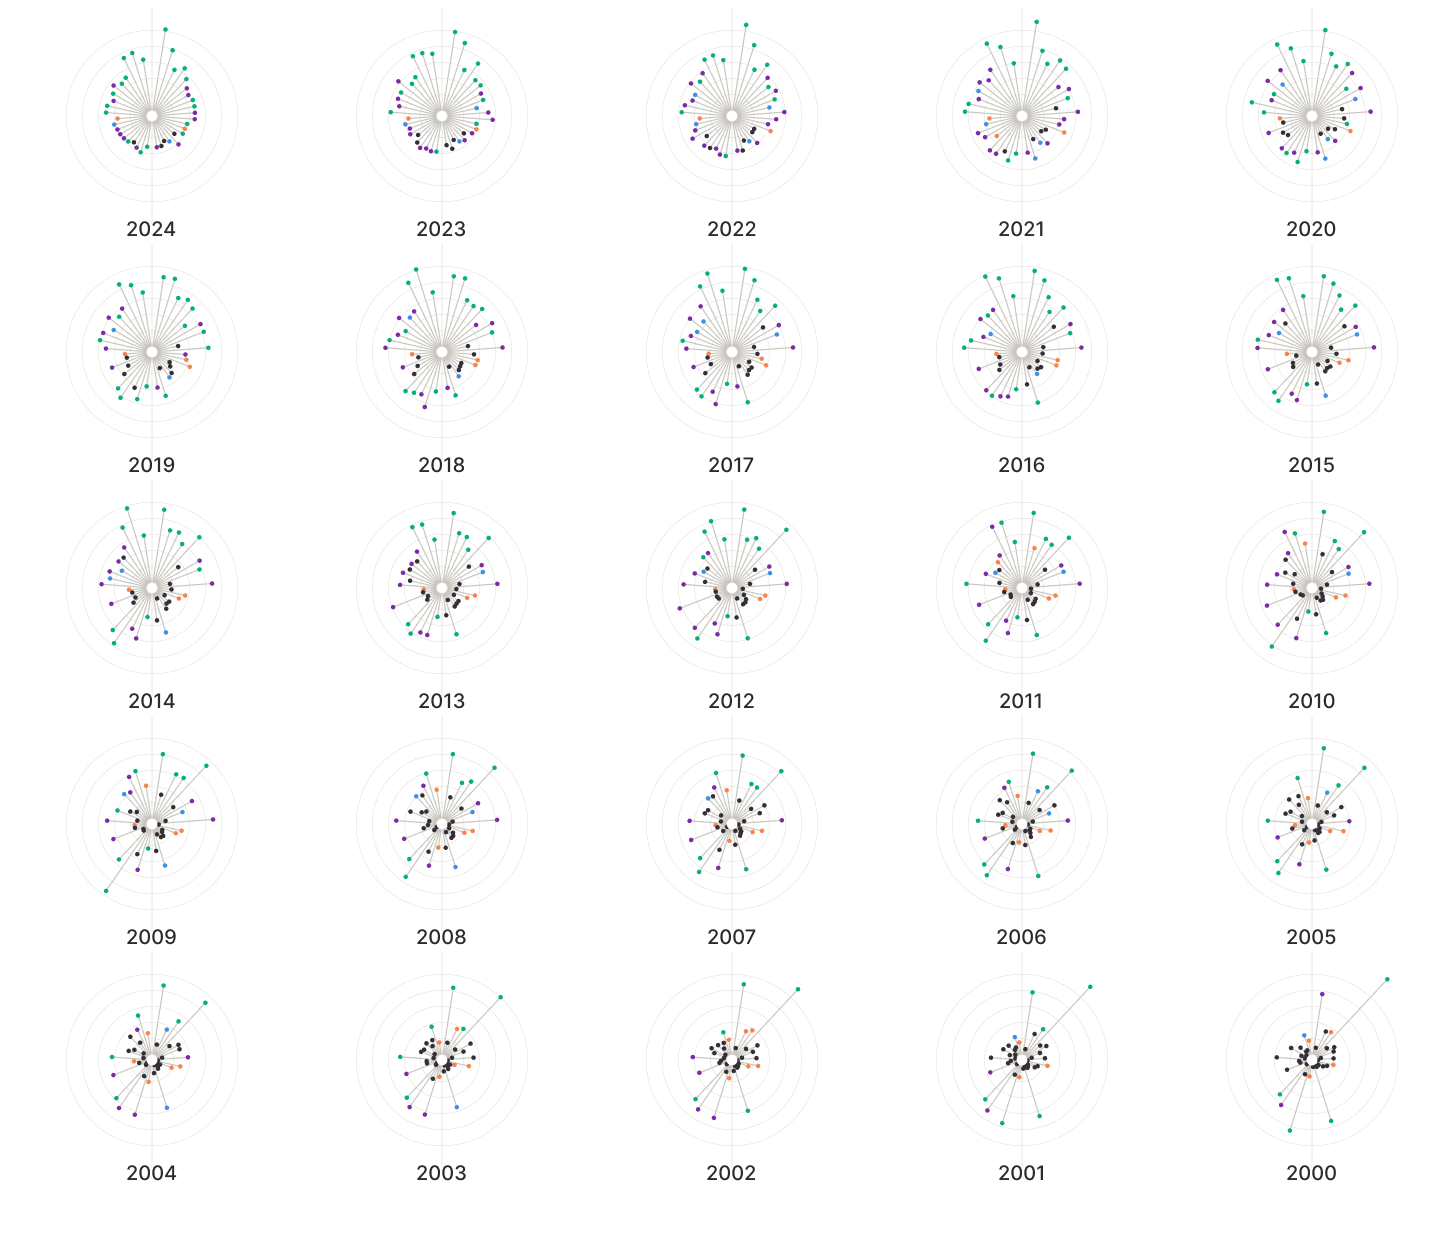
728 × 627 · export at 2×
While exploring the data, a few stories emerged. The one that stayed with me most: of the 20 most popular girls’ names in 2025, 19 end in “-a”.
That pattern deserved its own visualisation.
728 × 671 · export at 2×
Data has
a story.
I help
it get told.
I am a Senior UX & Data Visualisation Designer with 10+ years of experience transforming complex metrics into intuitive, human-centric interfaces.
Currently pursuing a PhD at the University of Portsmouth, focusing on qualitative research. My work bridges industry practice and academic research into data perception.
Trained at the University of Portsmouth. Currently working with clients across the UK and internationally.