A mockup of a screenshot (reduced due to NDA Agreement)
Clinician Overview
UX/UI
Brief
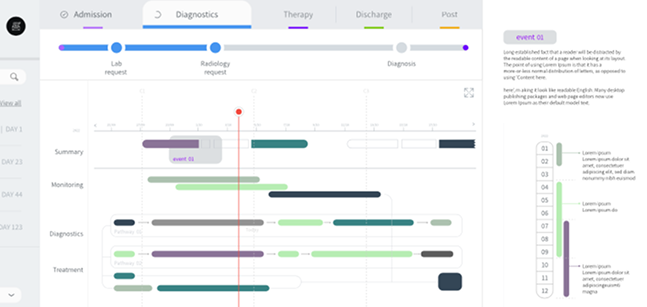
Carelane is a company focused on supporting doctors and patients involved in clinical trials. This screenshot from the project illustrates a screen designed to provide clinicians with an overview of a specific patient, allowing them to see what steps are expected in the trial and what the patient has already completed.
A mockup of a screenshot (reduced due to NDA Agreement)
The Solution
Addressing the complexity of clinical trial tracking by organising dense medical timelines into a highly structured, patient-centric interface. By utilising a clean horizontal Gantt-style timeline anchor with a minimalised layout that reduces cognitive load. A left-hand sidebar surfaces key historical events and a customisable detailed view, while the right-hand panel provides contextual, micro-level data for active events, ensuring that medical professionals have an actionable, macro-to-micro view of the clinical trial lifecycle without ever losing patient context.
I am a Senior UX & Data Visualisation Designer with 10+ years of experience transforming complex metrics into intuitive, human-centric interfaces.
A decade of UX practice, now focused on one question: how does data actually feel to the people reading it?
Currently a PhD researcher at the University of Portsmouth, my research explores how data visualisation can enhance understanding and engagement among individuals living with diabetes. My work investigates how data visualisation can bridge cold clinical metrics and the deeply lived experience of managing diabetes, transforming them into visual narratives that alter how individuals perceive and emotionally connect with data. Ultimately, my research aims to reframe data not just as a tool for analytical efficiency, but as a powerful, relatable medium for storytelling, connection, and personal insight.
Contact